Bubble
Bubble charts are Scatter Plot charts where a third dimension of data is represented by the sizes of plotted objects.
Bubble
Invalid Combination
Press Ctrl + C to copy
Guidelines
Use When
- Displaying the distribution of a set of items relative to three variables, where the third variable is represented through the size of the plotted objects, i.e., Return %, Standard Deviation, and Portfolio Weight.
Don′t Use When
- Displaying the distribution of items relative to only two axis variables. Instead, use a Scatter Plot.
- Showing the statistical correlations among a set of items. Instead, use a Correlation Matrix.
Visual Language
- Never use colors other than those defined in the visualization palette.
- Always use the relevant color orders and meanings from the visualization palette.
- Colored lines on each axis refer to each plot within the chart, precise axis data values.
- Use hover crosshairs when it is important to be able to see a plotted item’s exact placement on each axis.
- Use the grid view when a more precise frame of reference is needed to link plotted items and the chart axes.
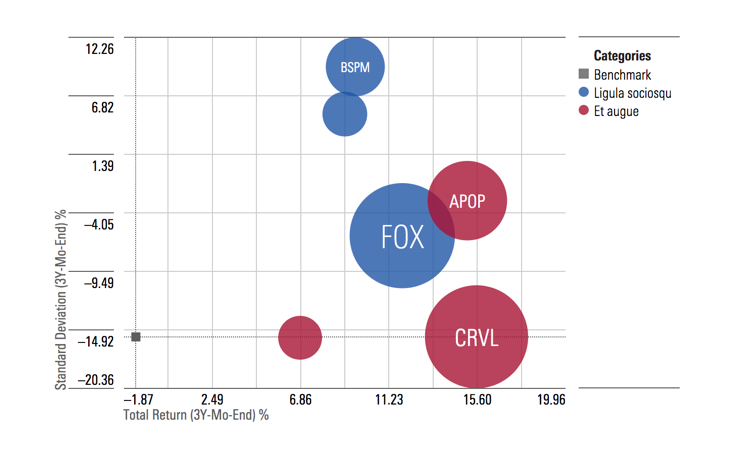 Bubble chart using the grid view.
Legend
- At chart container widths of
600pxor less, the legend will move to the top of the chart. This is the default width for this behavior to occur, the width can be adjusted by setting thebreakpointparameter. - When the legend is at the top and contains more items than fit in the available space, the full legend is accessible within a Popover triggered by an Icon-Only Button.
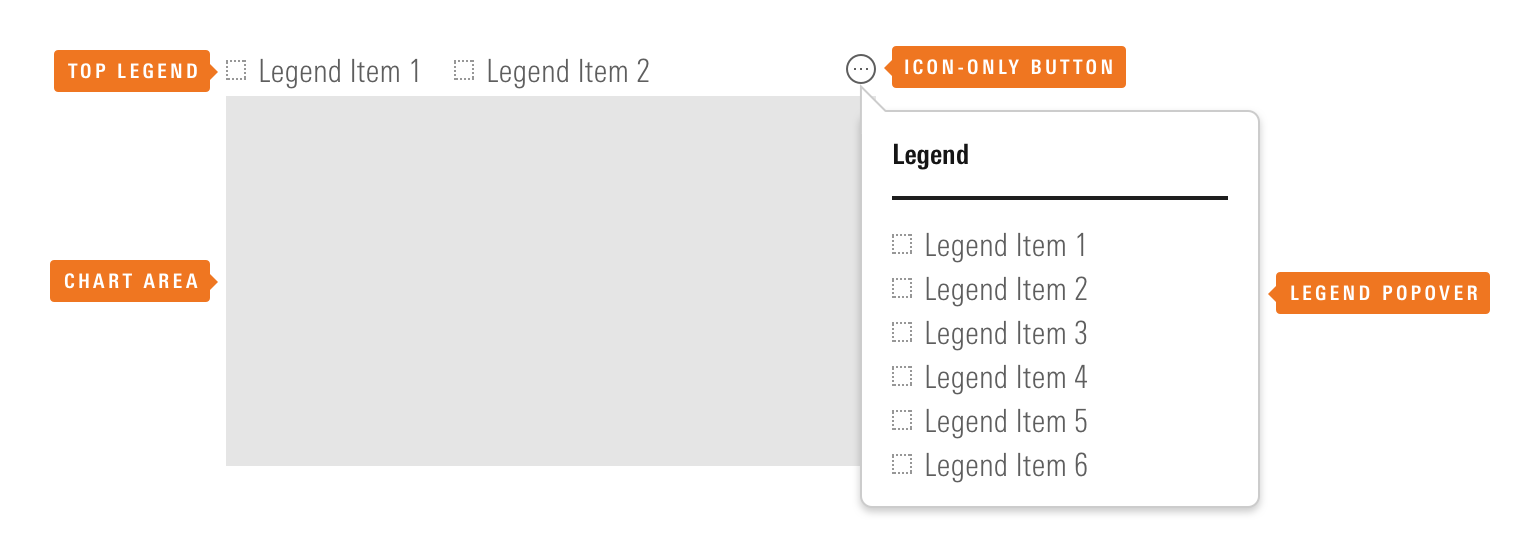 The Icon-Only Button provides access to the full legend within a Popover.
- The Popover containing the full legend includes logic to prevent it from overlapping the chart unless there is no space available to the right of, or above, the data visualization.
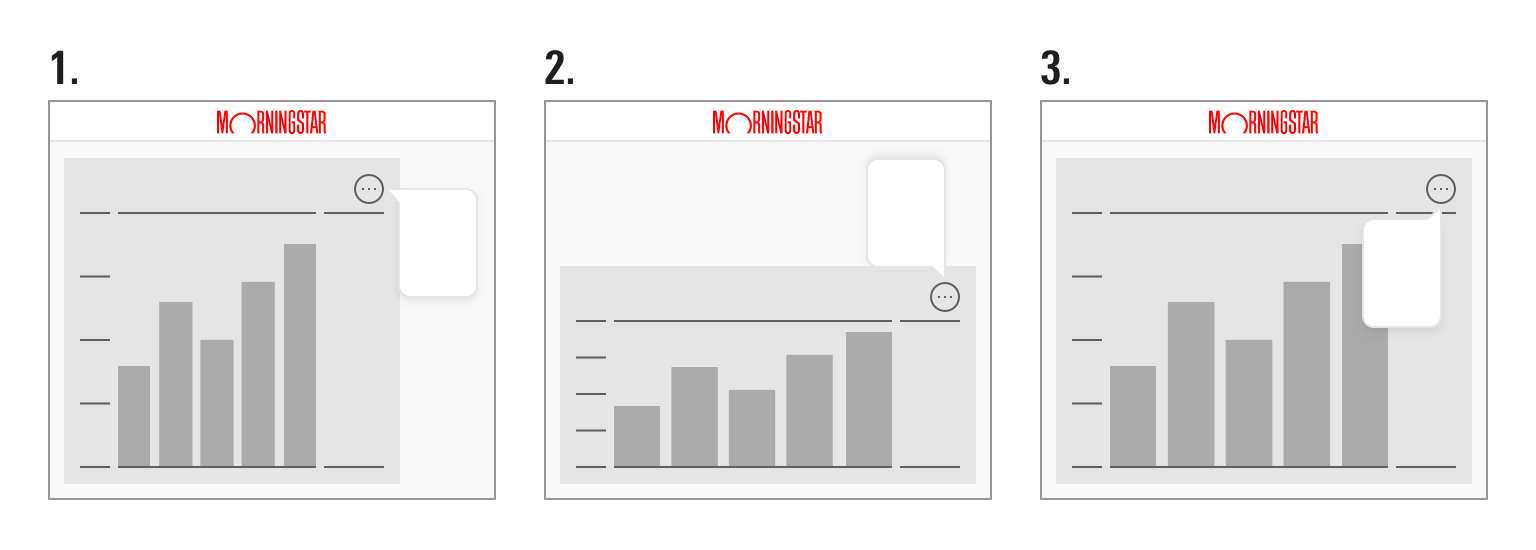 The Popover containing the full legend has three potential positions based on the space available to the right of, and above, the chart.
Behaviors
- When hovering over an item in the legend, all plotted items associated with that item become opaque, while all other plotted items and legend items fade back.
- When hovering over a plotted item, the plotted item and its matching legend item become opaque, while all other plotted items and legend items fade back. A tooltip appears, surfacing the underlying data values of the holding, including its weight within its holding group.
Responsiveness
- Bubble charts will resize to fill the available space. Avoid using them at widths below
200pxand heights below150pxto prevent axis value/label collision and clipping. - The tickers within the bubbles only appear when there is enough room.
- Set the
breakpointparameter to control the width of the chart container (in pixels) at which the X-axis shows only the first, middle, and last X-axis value whenview: "grid". Thebreakpointparameter also sets the size at which the legend moves to the top of the chart. By default, it is set to600.
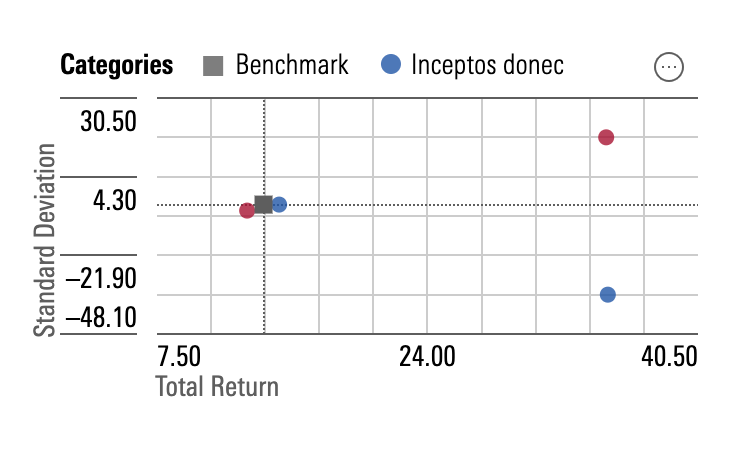 Bubble chart when it is smaller than the size passed in the
 breakpoint parameter.
- Set the
xAxisLabelBreakpointparameter to control the width of the chart container (in pixels) at which the X-axis shows show every other X-axis value. By default, it is set to800. - Consider limiting the number of decimal places shown in axis values to the amount that is useful to users. Longer axis values have a higher potential for issues at smaller sizes.
Editorial
- Strive for short, succinct axis labels and legend items that clearly describe the data.
- Include the unit or increment in axis labels.
Code Reference
Necessary code documentation can be found in the MBC repository.