
Nadhim Orfali
Senior Software Engineer
Remembering the mantra of building software ALL users love
August 28, 2022. Building inclusive and accessible data visualizations is challenging. No single approach will meet the needs of every user, but one way we can empower users is to provide alternative ways to navigate a chart using a keyboard. Here is how MCE can help you achieve that.
One way we can empower users is to provide alternative ways to navigate a chart using a keyboard.
While a static chart like the one below serves a purpose, a user might want to interact with it to gather more insights about a specific data point. A lot of common interactions are usually done with a mouse device.
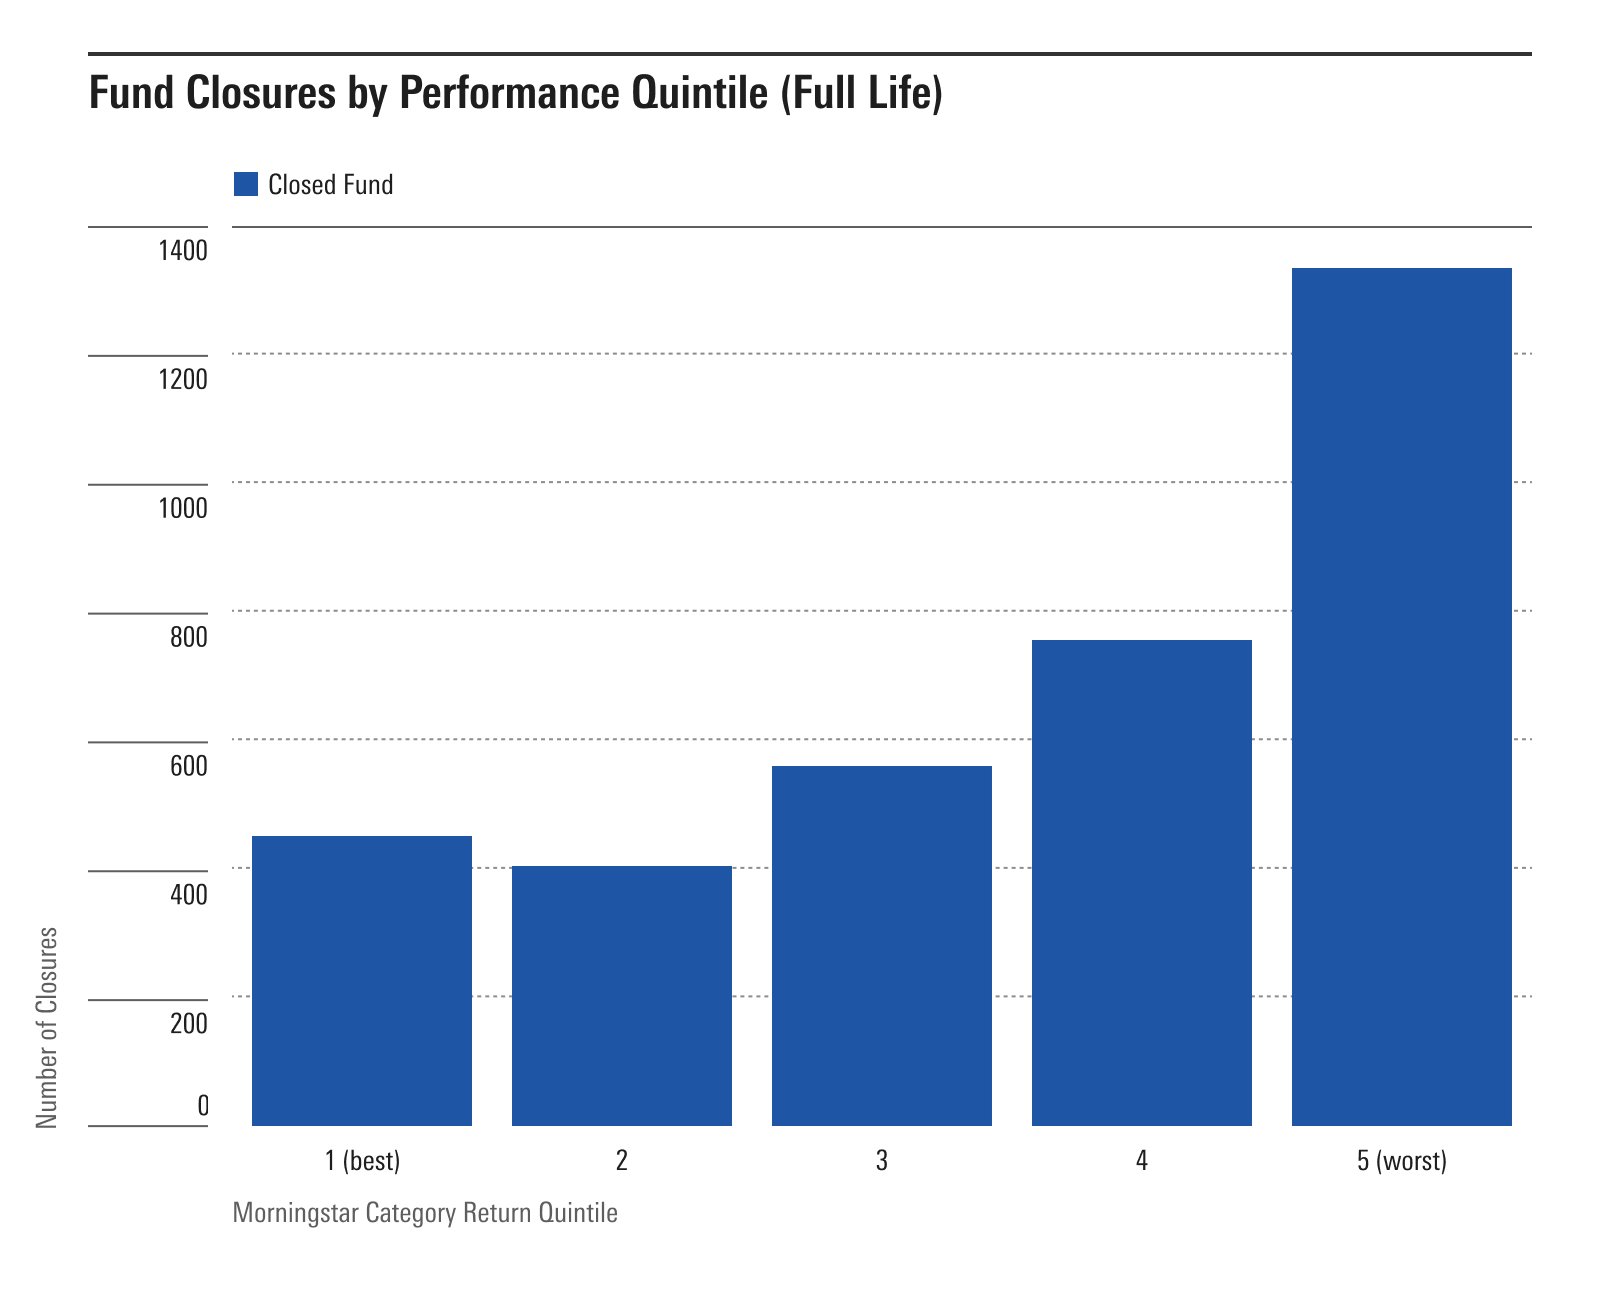
Using the mouse interaction along with the addition of MCE Hover Flag, works well for many users, but not all:
This doesn’t help for those who might want or can only use a keyboard. How can we offer the same experience for these users?
This property is supported for all plot types, making it possible to set focus on individual data points within a chart.
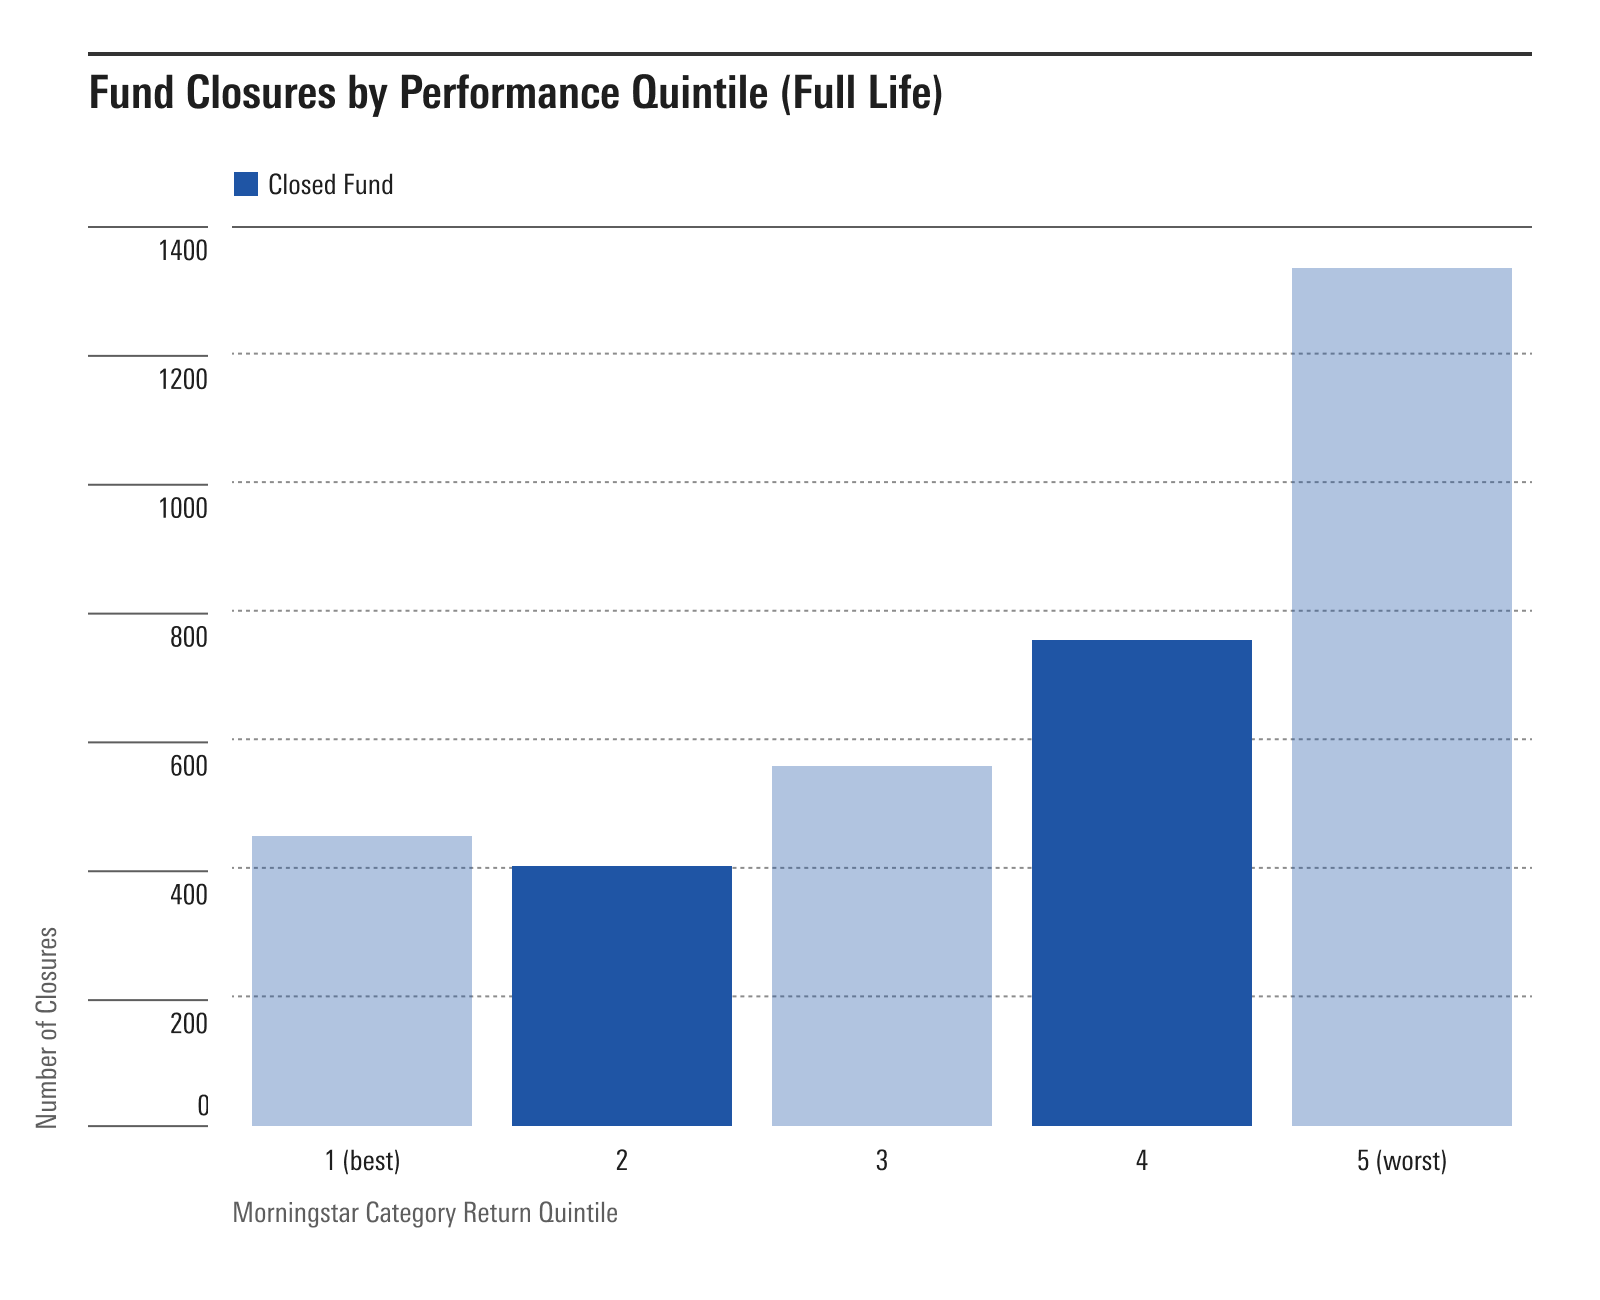
The flexibility of the dataFocused property allows you to:
So given the details, what if we add buttons for users to navigate through data points?
So, let’s review the code for the demo. We added a button container with a set of buttons:
<mds-button-container class="data-navigation">
    <mds-button
        type="button"
        variation="secondary"
        size="small"
        :disabled="focusDataIndex === -1 || focusDataIndex === 0 ? true : false"
        @click="barPlotInteract('previous')"
    >
        Previous Data Point
    </mds-button>
    <mds-button
        type="button"
        variation="secondary"
        size="small"
        :disabled="focusDataIndex + 1 < plotData.length ? false : true"
        @click="barPlotInteract('next')"
    >
        Next Data Point
    </mds-button>
    <mds-button
        type="button"
        variation="secondary"
        size="small"
        @click="resetData()"
    >
        Reset
    </mds-button>
</mds-button-container>
Buttons are accessible by default. So it makes sense to leverage the power of native HTML and by doing so, you help fill the need for users of screen readers and keyboard shortcuts to navigate the data points of a chart.
A small sprinkling of appropriate ARIA magic like aria-live and a region role to the Hover Flag greatly assist screen reader users who might be interested in a specific set of data points:
<mce-hover-flag
    v-if="isFlagVisible"
    :x="hoverFlagPosition.pageX"
    :y="hoverFlagPosition.pageY"
    role="region"
    aria-live="polite"
>
...
Users who either prefer to use a keyboard or are unable to use a mouse device can still use the visual affordance of the chart.
This example uses buttons to cycle through data points. Other solutions could be toggling between categories, adding a search/filter, or showing data points within a date range. The MDS Team is excited to see how the product teams at Morningstar leverage the dataFocused property!
If you have any questions or comments about this functionality, please do not hesitate to let us know!