
Jonathan Healy
Design System Product Manager
Announcing the production launch of MDS Chart Elements
August 29, 2022—The MDS team today announces the launch of MDS Chart Elements for production use. Built using Vue, Chart Elements make it easy for product teams and front end developers to create data visualizations that are:
Chart Elements mirror the design of existing Morningstar Base Charts (MBC), while meeting new requirements for accessibility, brand, and technology support.
Rather than anticipate every use case, MDS Chart Elements empower teams to solve problems on their own.

Chart elements look great. The plug and play gives us great flexibility.
Ensuring that the elements we provide are accessible to everyone is a guiding principle of MDS.

While guidelines for accessibility are provided, product teams are responsible for implementing those guidelines in their products.
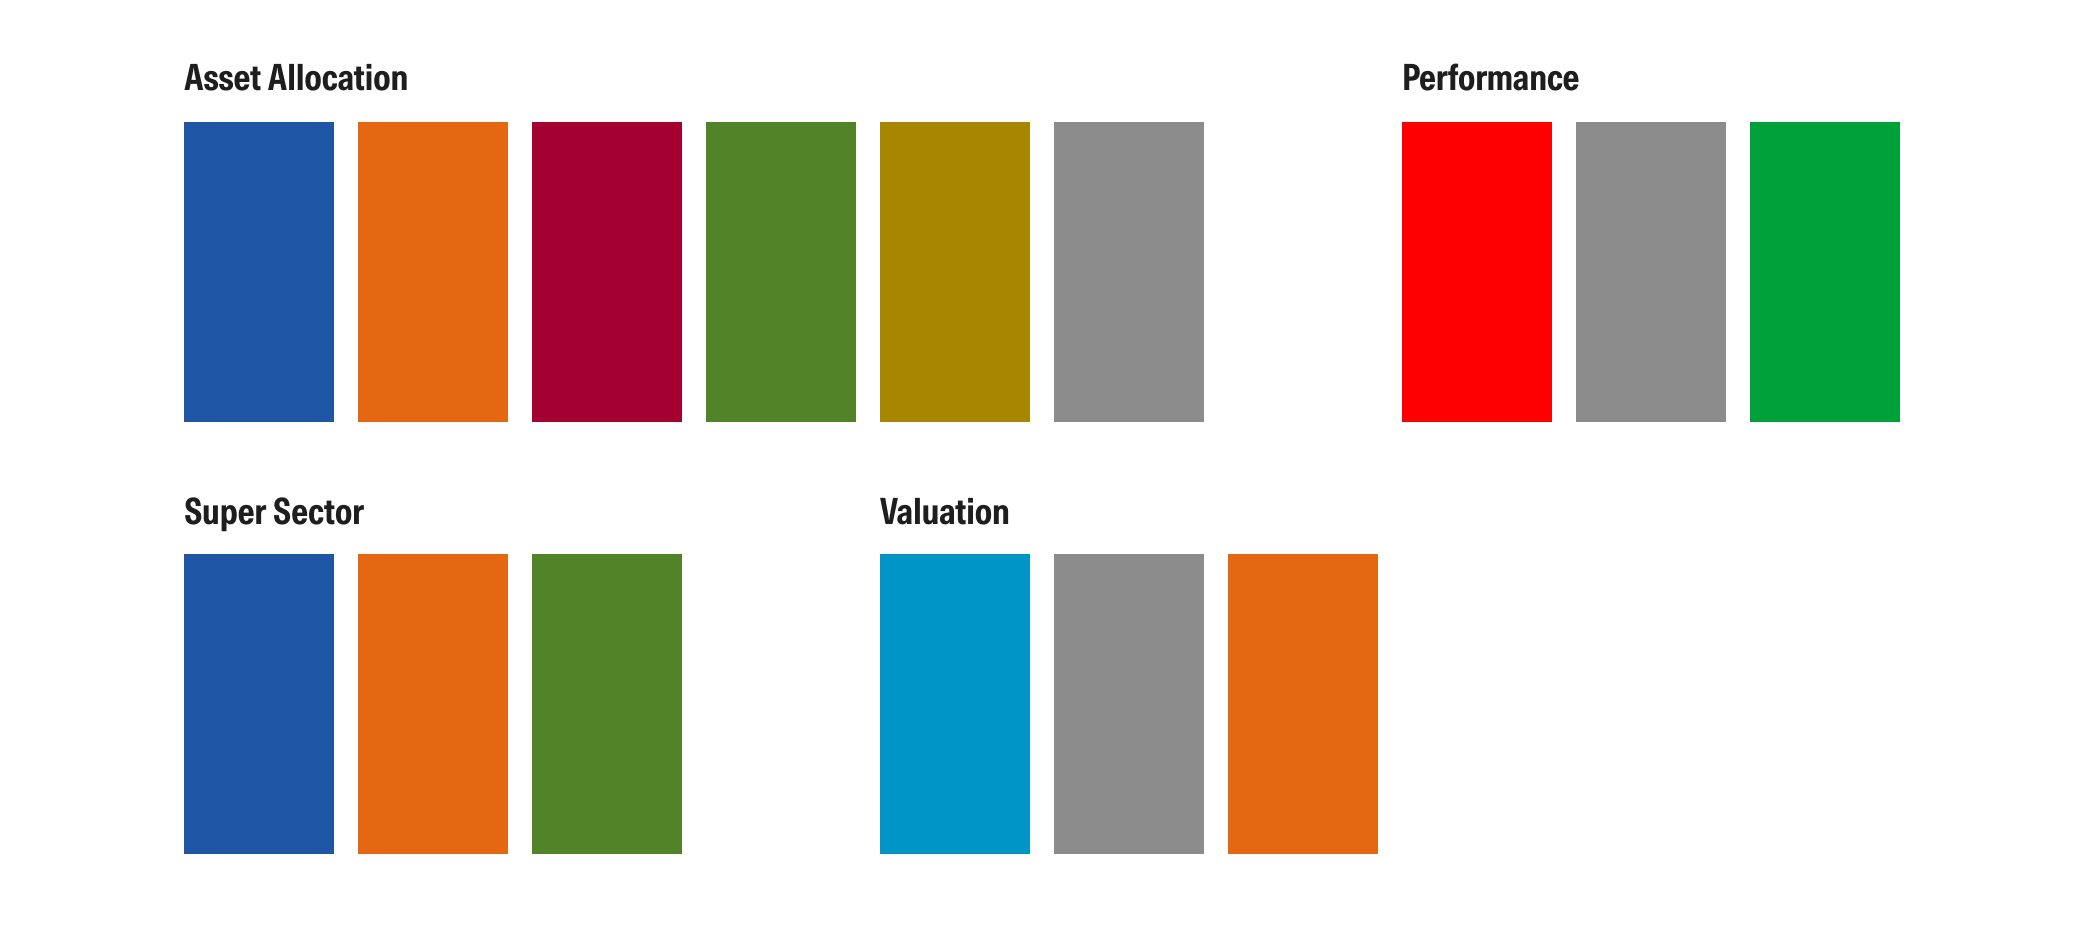
Using more than five colors is likely to create challenges for color blind users.
Design is in the details. How do you choose the interval for a time series line chart when the horizon is uncertain? How many tick marks is too many? When should you use a grouped bar chart rather than a stacked bar chart? Do you need zebra stripes to make the grid easier to see?
MDS Chart Elements put these details in the hands of product teams, and empower teams to contribute updates as new requirements emerge. Which is why releasing the library is only the beginning. The real story begins today, with the stories and experiences that Morningstar product teams create for our users.
Built to evolve, Chart Elements will change the way teams create data visualizations, while upholding the mission that has guided MDS since 2017.
As of August 2022, Chart Elements include all elements necessary to meet or exceed the functionality of Morningstar Base Charts (MBC) for the standard chart types listed below. The corresponding MBC charts have been deprecated. MBC will continue to be supported through an interim period, however new development will focus on Chart Elements.
The only exceptions are the IP Charts (style box, style map, geographical map, and correlation matrix). Until further notice, MBC remains the supported solution for these chart types.
| Chart Type | Chart Elements (MCE) | Morningstar Base Charts (MBC) |
|---|---|---|
| Donut | ✅ | Deprecated |
| Vertical Bar (Simple, Stacked, Grouped) | ✅ | Deprecated |
| Horizontal Bar (Simple, Stacked, Grouped) | ✅ | Deprecated |
| Line | ✅ | Deprecated |
| Time Series Line | ✅ | Deprecated |
| Scatter Plot | ✅ | Deprecated |
| Weighted Scatter Plot (Bubble) | ✅ | Deprecated |
| Style Box | ✅ | |
| Style Map | ✅ | |
| Geographical Map | ✅ | |
| Correlation Matrix | ✅ |
The best way to get started with MDS Chart Elements is to browse the documentation, and explore our library of examples.
For more background on MDS Chart Elements, see the following links:
The codepen collection has been a major help for getting our Playfair templates going.
The MDS team would like to thank all those who shared requirements and feedback on the Chart Elements beta. In particular, we would like to thank the following individuals whose work was instrumental in shaping the design, development, and testing of MDS Chart Elements: