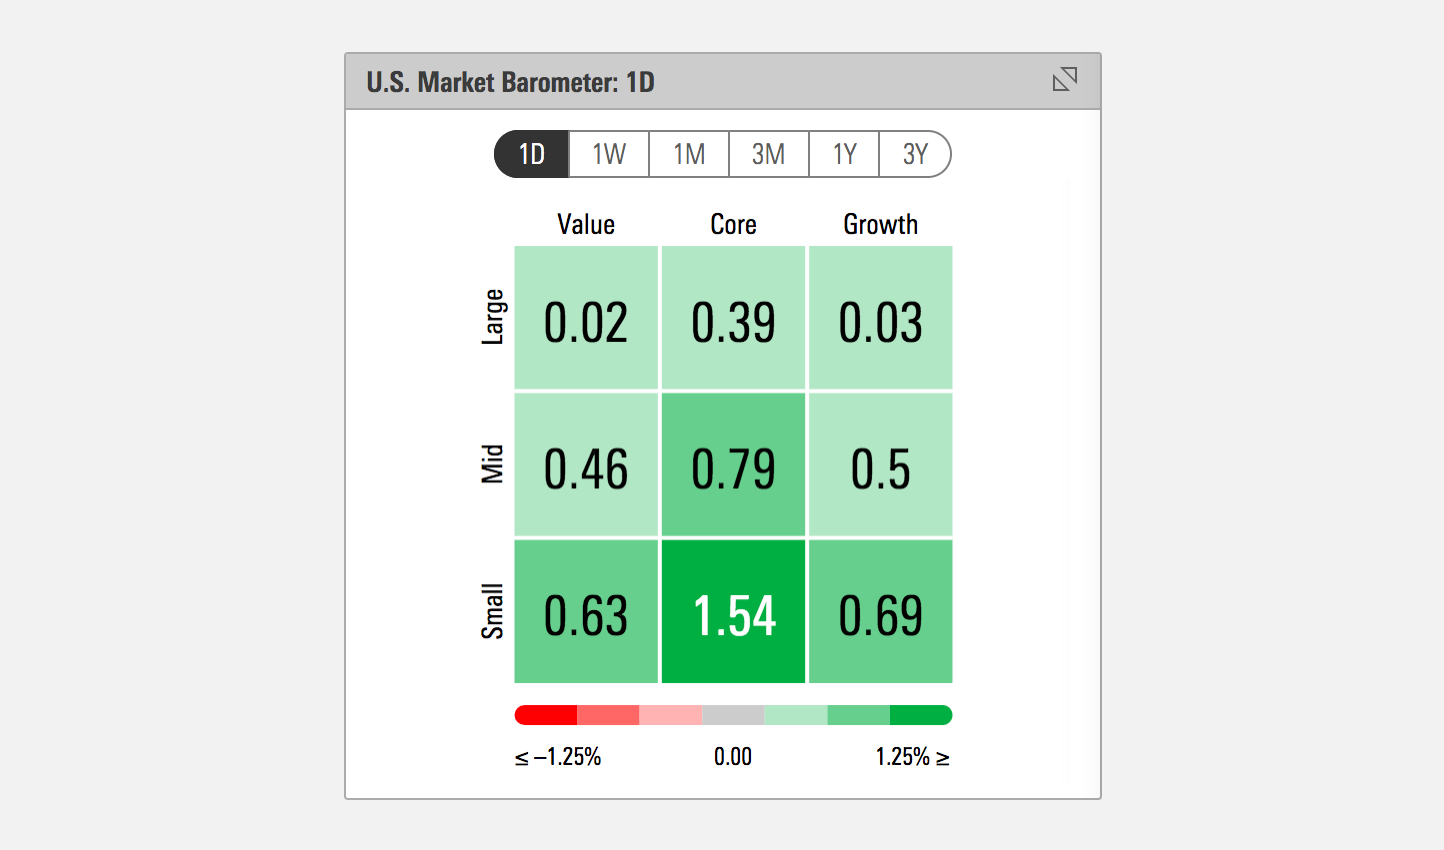
Market Barometer
Market Barometers show the performance of companies of all sizes and investment styles over a given a period of time. They are a key piece of Morningstar intellectual property and must be displayed consistently across all implementations.
Style Box Chart
Example
Use to represent market performance in relationship to market capitalization and growth vs. value factors.
Guidelines
Visual Language
- Never assign new colors to the Market Barometer. Always use the Performance palette.
- Always pair Market Barometers with an appropriate label, such as a component title or section header.

Responsiveness
The responsive behavior for the Market Barometer takes a desktop-first approach. This means that, as the size of the Market Barometer’s container reduces, the chart’s internal components will adjust to more efficiently use the space.
| Container Width |
Result |
|---|---|
|
|
The label sizes reduce, and internal padding between elements tightens. |
|
|
The label sizes and internal padding reduce again. |
|
|
The labels abbreviate and their size and internal padding reduce again. |
|
|
Labels are removed. |
|
|
The values within the cells are removed. |
Editorial
- Never change the labels on the axes or legend of the Market Barometer.
Code Reference
Necessary code documentation can be found in the MBC repository.

