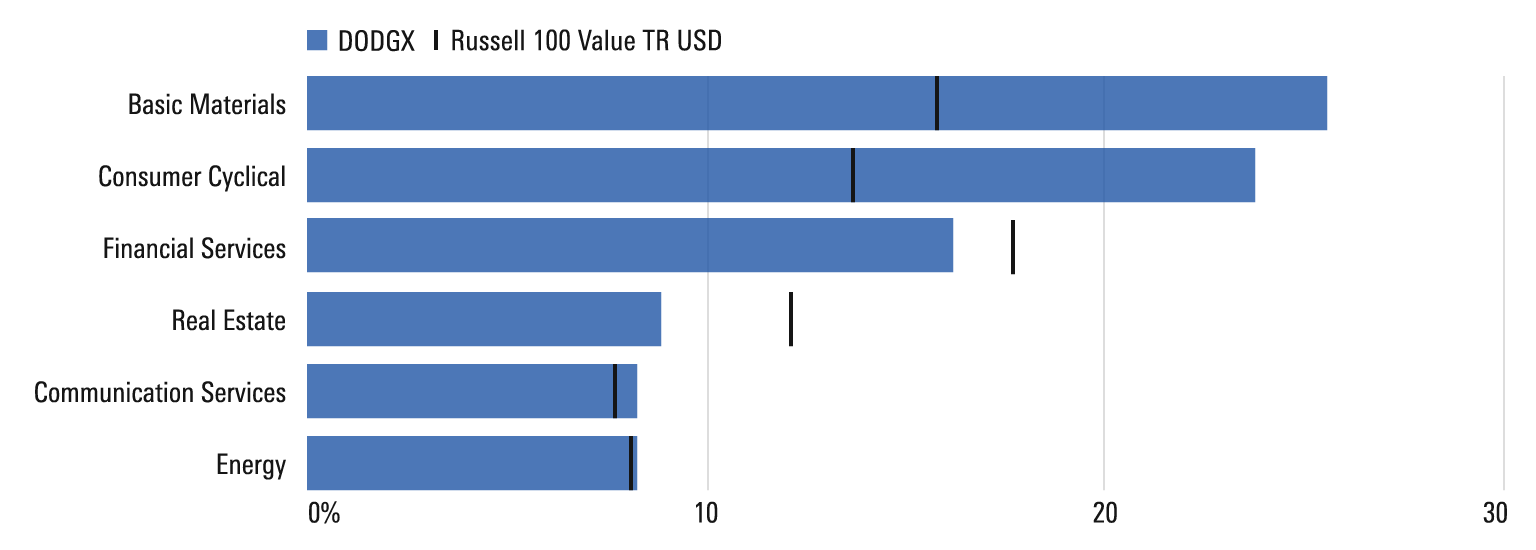
Horizontal Bar
Horizontal Bar charts compare different items.
Horizontal Bar
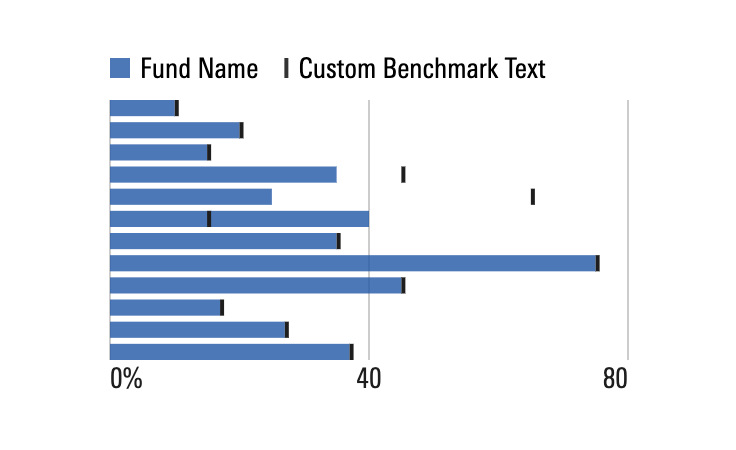
Invalid Combination
Press Ctrl + C to copy
Guidelines
Use When
- Representing information compared against other information, particularly data with long labels.
Don′t Use When
- Representing trend. Instead, use a Line chart or a Time-Series Line chart.
- Comparing information over time. Instead, use a Vertical Bar chart, Line chart or Time-Series Line chart.
- Comparing proportions that total to 100%. Instead, use a Donut chart.
Visual Language
- Never use colors other than those defined in the visualization palette.
- Always use the relevant color orders and meanings from the visualization palette.
Responsiveness
- Horizontal bar charts will resize to fill the available space.
- At chart container sizes of
400pxor less, the number of x-axis values and grid lines reduces. This is the default width for this behavior to occur, the width can be adjusted by setting theouterWidthBreakPointparameter.
- Set the
outerWidthBreakPointparameter to control the width of the chart container (in pixels) at which the number of X-axis values reduces to the amount set forbreakPointTickNumbers. By default,outerWidthBreakPointis set to400andbreakPointTickNumbersis set to2. The number set forbreakPointTickNumberscontrols the number of X-axis values in addition to the zero value which render on the X-axis.
 The number of X-axis values shown when
 breakPointTickNumbers is set to 2.
Editorial
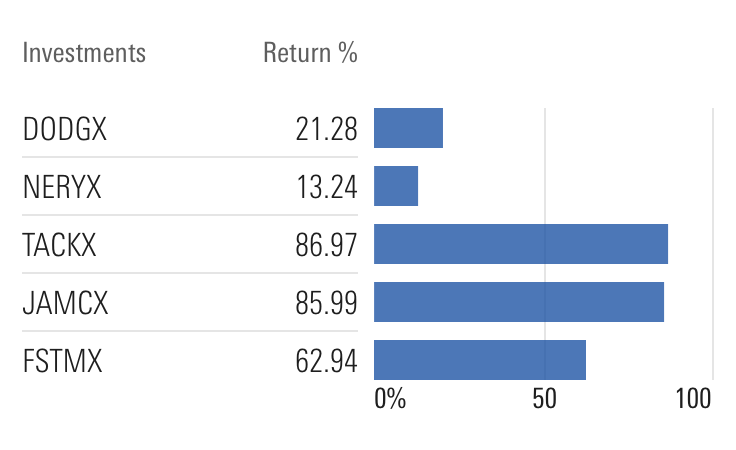
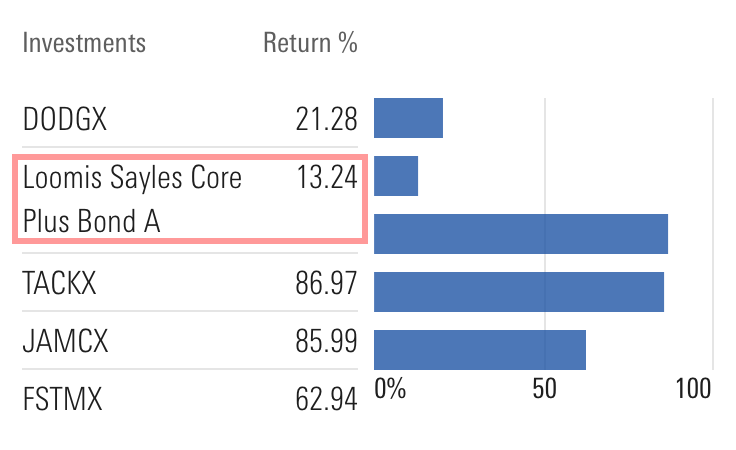
- Strive for short, succinct axis labels and legend items that clearly describe the data.
- Include the unit or increment in axis labels.
Code Reference
Necessary code documentation can be found in the MBC repository.