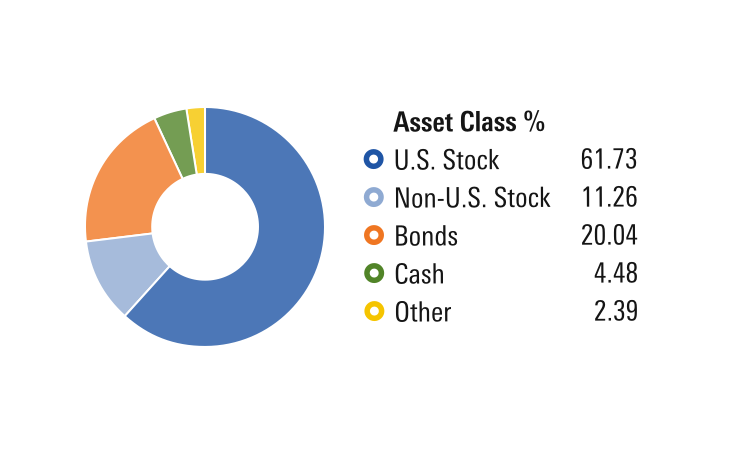
Donut
Donut charts show the proportional composition of an item.
Donut
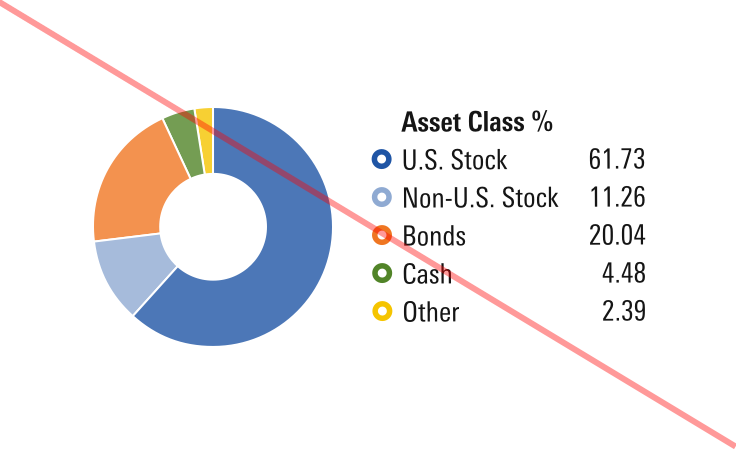
Invalid Combination
Press Ctrl + C to copy
Guidelines
Use When
- Showing how an item is composed of various parts, with all the parts totaling 100%.
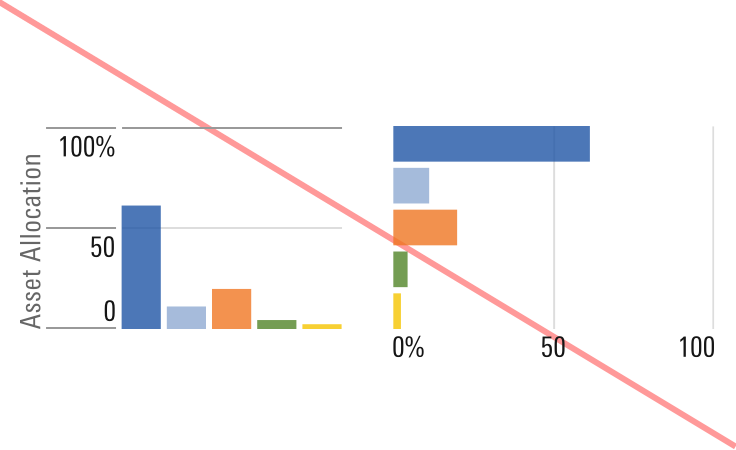
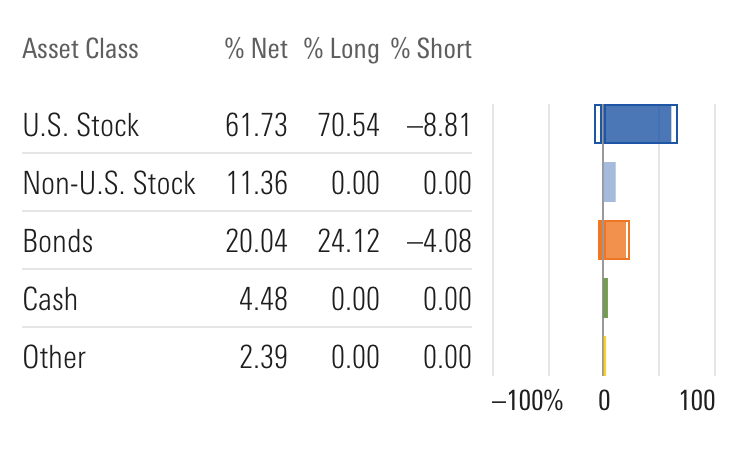
Don′t Use When
- Representing the composition of an individual item that features both positive and negative values, that may or may not total 100%. Instead, use a Horizontal Bar chart.
Visual Language
- Never use colors other than those defined in the visualization palette.
- Always use the relevant color orders and meanings from the visualization palette.
Responsiveness
- Donut charts will resize to fill the available space. Avoid using them at widths below
200pxand heights below150px. - Donut charts retain their aspect ratio regardless of the width of their container, flexing their size fluidly to become larger or smaller. The legend exists in a separate container,
donut-legend-container, allowing teams to determine their own responsive behavior.
Editorial
- Strive for short, succinct axis labels and legend items that clearly describe the data.
Code Reference
Necessary code documentation can be found in the MBC repository.